Cheat sheets for the epidemiologist using R
In this brief post, I'm sharing some useful cheat sheets for performing common data management and analysis tasks in R. These cheat sheets were made available by RStudio and their user community: https://rstudio.com/resources/cheatsheets/. I'm reposting ten of the more useful cheat sheets particular to epidemiologic research, categorized by data management versus analysis. Required R packages are bolded, otherwise the functionality is available in base R. Enjoy!
Data Management
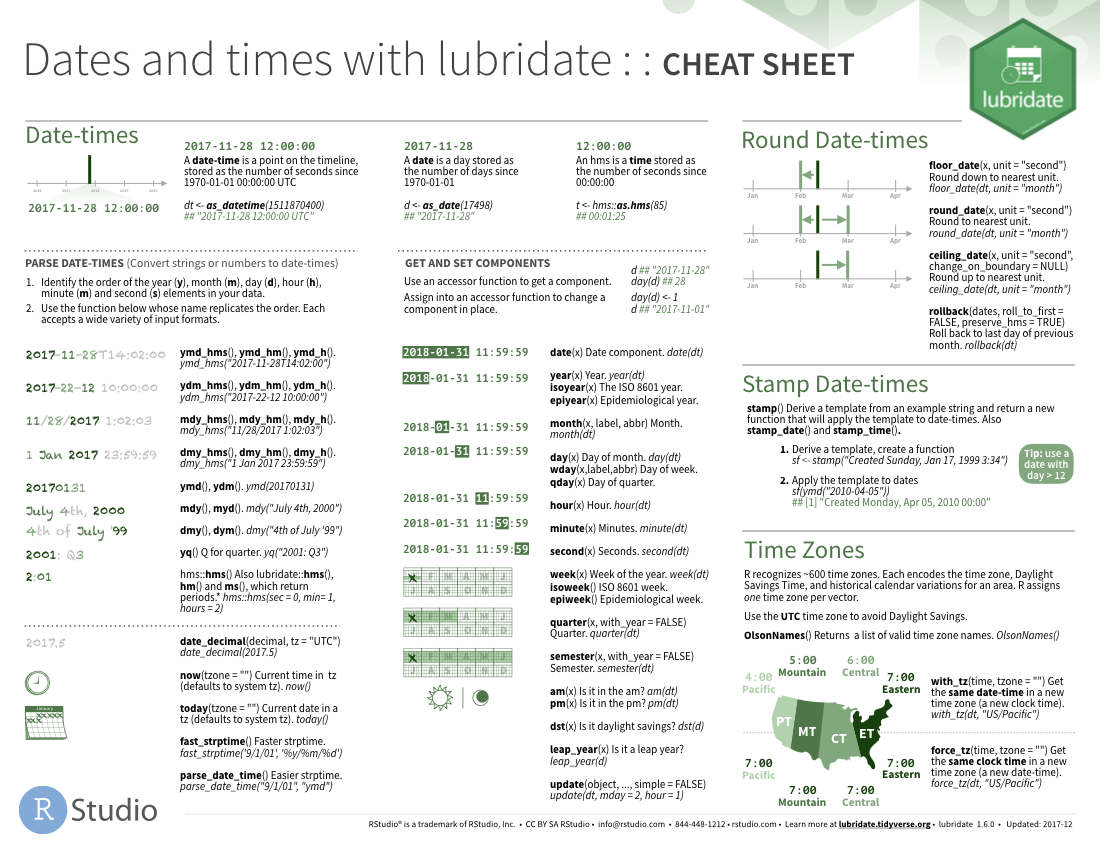
1. Date and time manipulation via lubridate. Working with dates and times in R can be frustrating using the base functions. This package makes life much easier. https://github.com/rstudio/cheatsheets/raw/master/lubridate.pdf
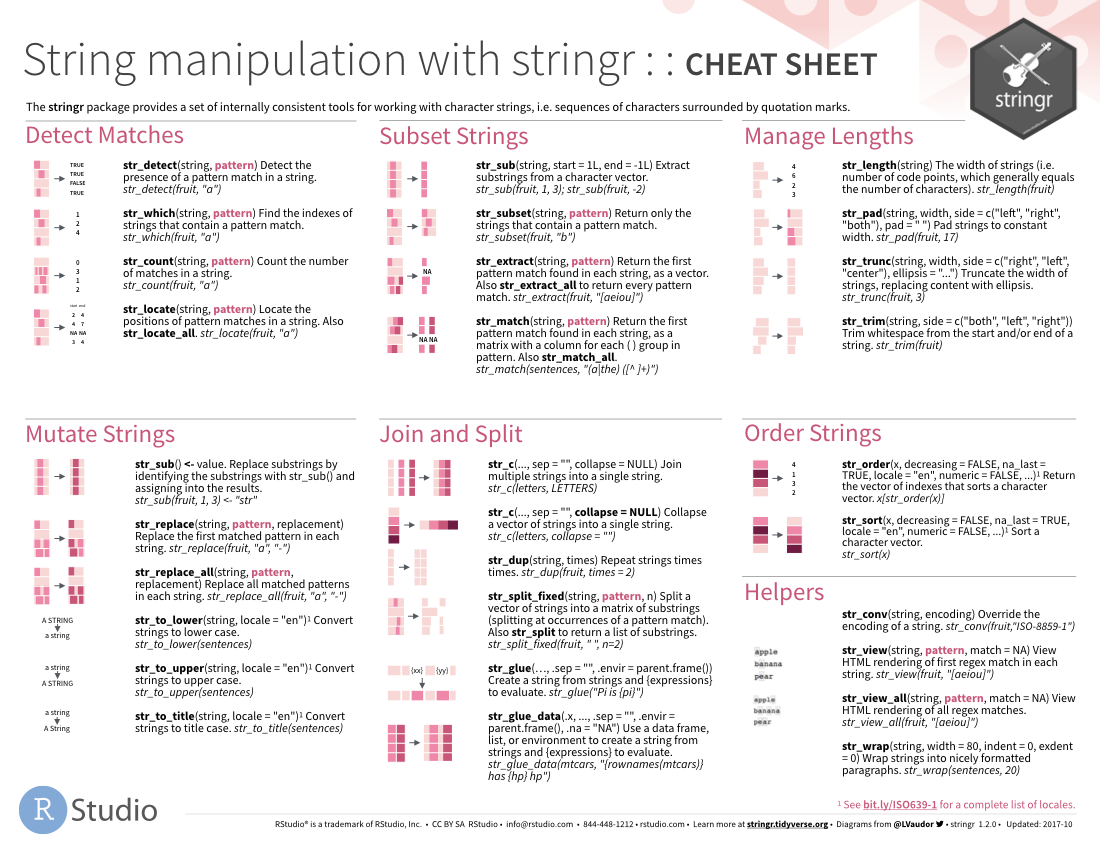
2. Working with strings via stringr. This package implements a variety of useful string comparison and manipulation functions in an a much more intuitive manner. https://github.com/rstudio/cheatsheets/raw/master/strings.pdf
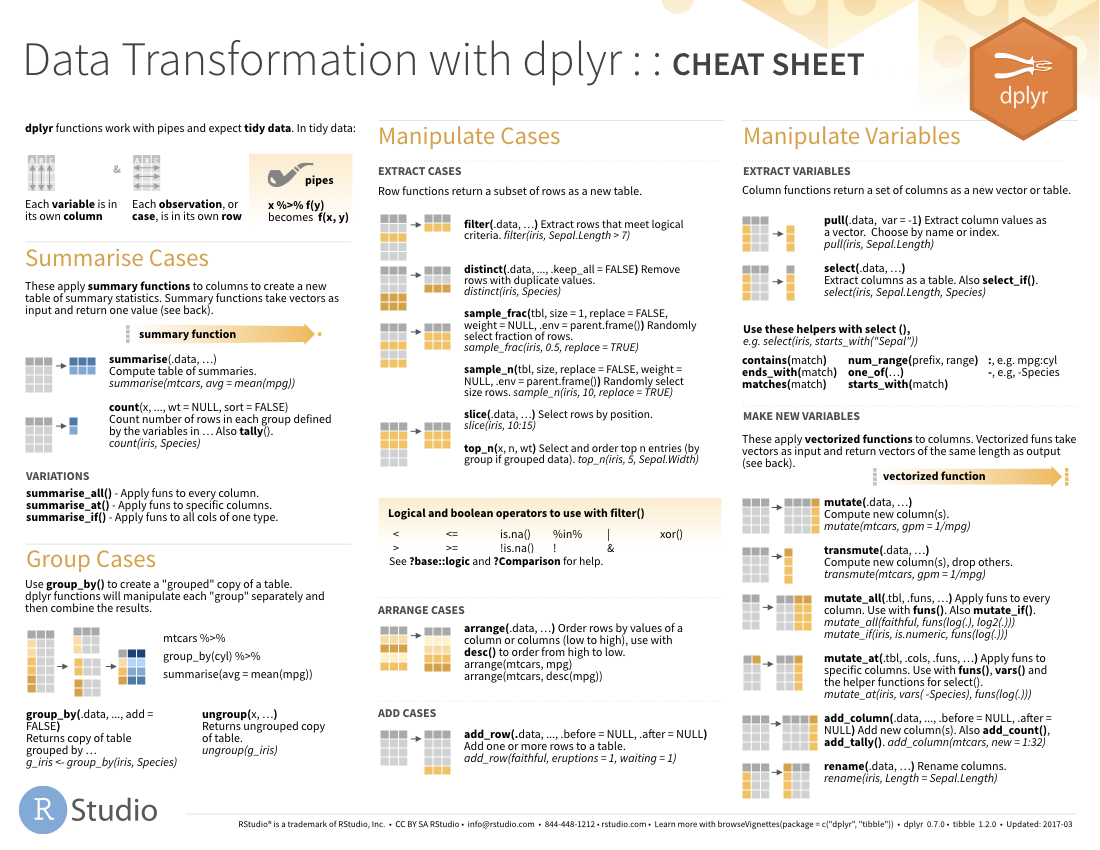
3. Data transformation via dplyr. Although I don't specifically use dplyr, it is quite popular for manipulating tables (data frames). https://github.com/rstudio/cheatsheets/raw/master/data-transformation.pdf
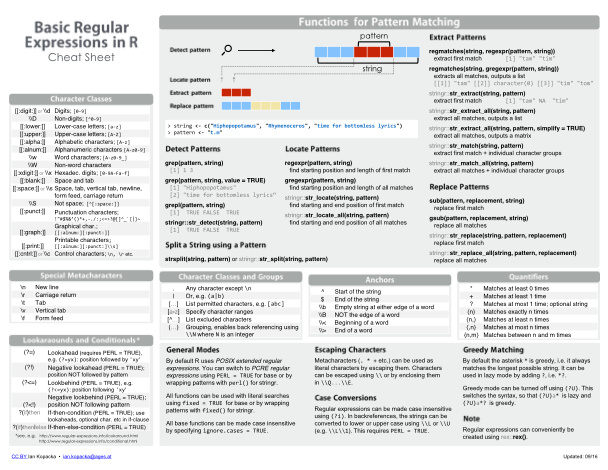
4. Regular expressions in R. While sometimes difficult to understand (and certainly difficult to master), using regular expressions unlocks a world of data parsing possibilities, especially when using free form text (e.g., website scraping). https://github.com/rstudio/cheatsheets/raw/master/regex.pdf
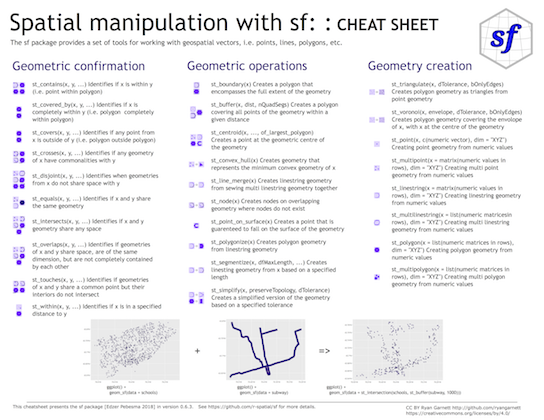
5. Working with spatial vector data via sf. For those who work with geospatial data in R, at some point you will be working with this package. Understanding the structure of these objects will allow useful transformations necessary for a variety of analyses. https://github.com/rstudio/cheatsheets/raw/master/sf.pdf
Analysis and Dissemination
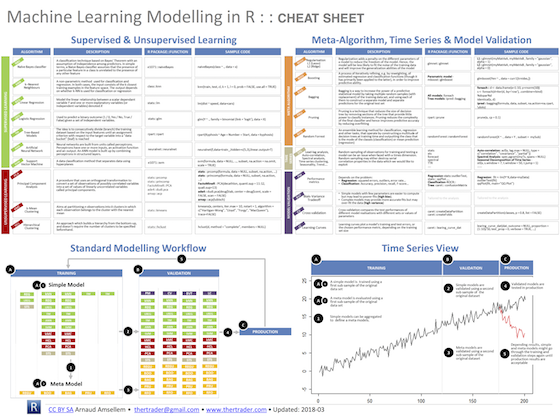
6. Machine learning in R. For those interested in machine learning and looking for patterns in high dimensional data, there are a wealth of packages available in R. This cheat sheet is a nice summary of the more popular ones, organized by the class of machine learning approach. https://github.com/rstudio/cheatsheets/raw/master/Machine%20Learning%20Modelling%20in%20R.pdf
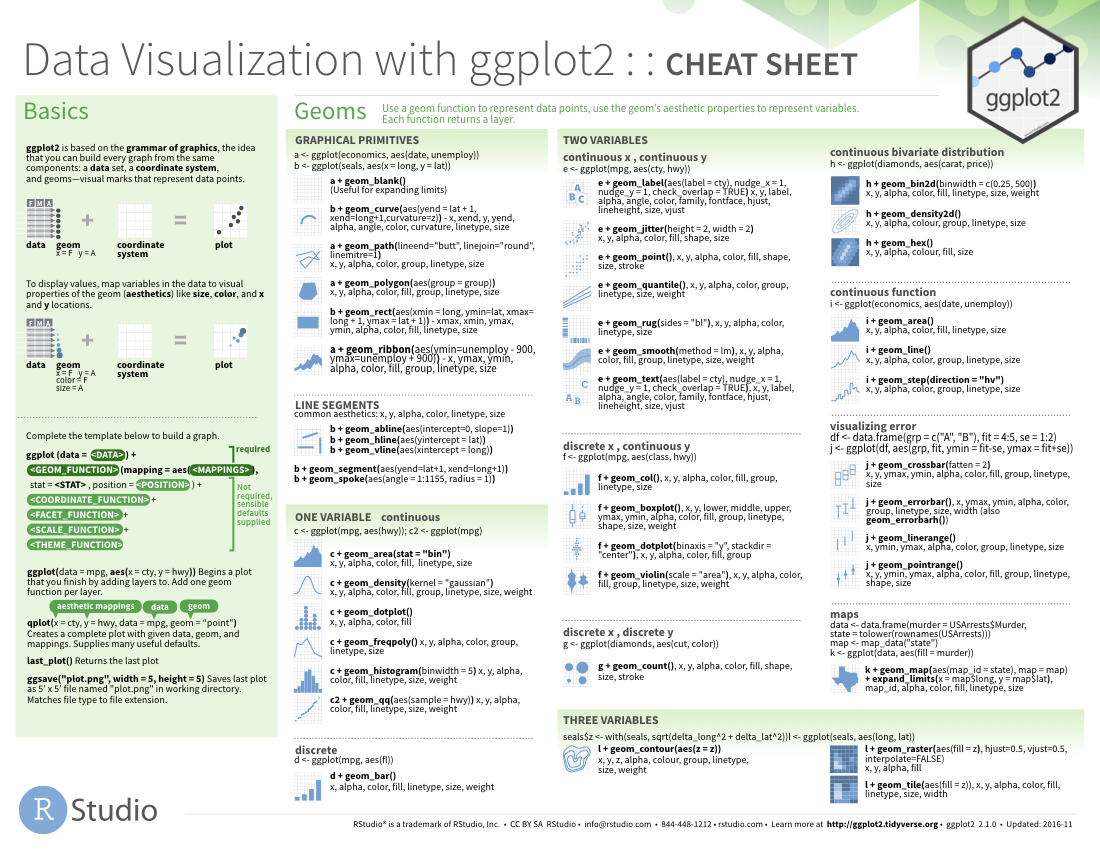
7. Plotting and data visualization using ggplot2. R is well known for its graphic capaiblities, and ggplot2 has a lot to do with this reputation. https://github.com/rstudio/cheatsheets/raw/master/data-visualization-2.1.pdf. Also, for those still grappling with the plotting window in R, see: https://github.com/rstudio/cheatsheets/raw/master/how-big-is-your-graph.pdf
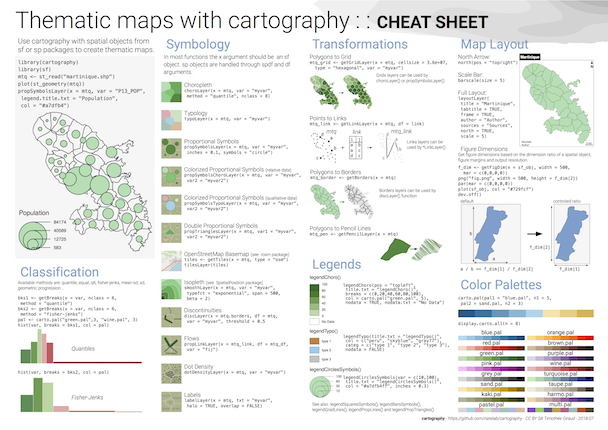
8. Mapping via cartography. Anyone in the geospatial world appreciates the ease with which ArcGIS and QGIS can create stunning maps. Many, if not all, geospatial tasks can be accomplished in R. This package demonstrates how to create thematic maps with spatial objects. https://github.com/rstudio/cheatsheets/raw/master/cartography.pdf
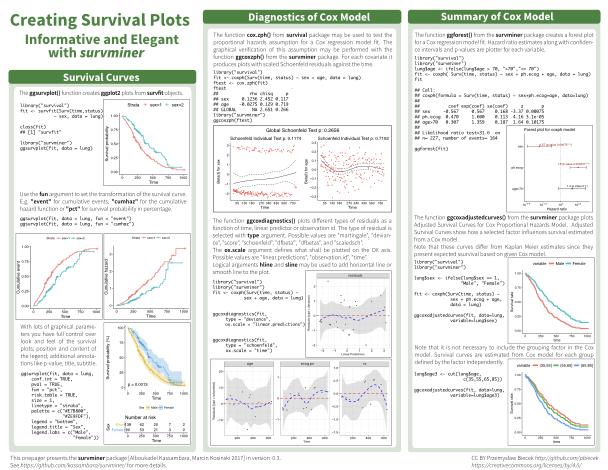
9. Survival plots via survminer Survival analysis in R has come a long way in recent years. This package enables the creation of survival plots that match anything SAS can create. https://github.com/rstudio/cheatsheets/raw/master/survminer.pdf
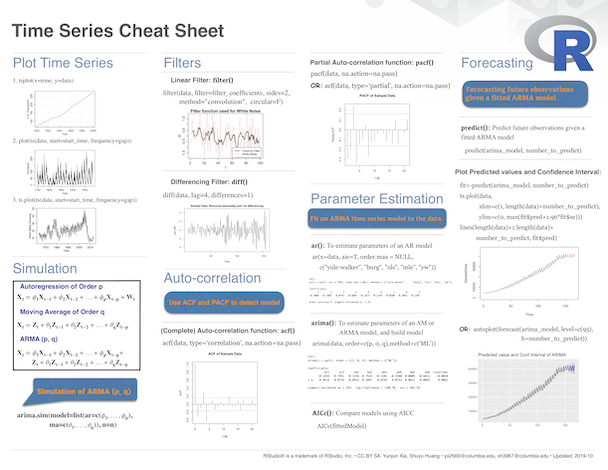
10. Time series analyses in R. Time series analyses are useful to detect trends or before and after effects of an intervention, quite common in epidemiology. Doing these plots and analyses is easy with R's built in functions. https://github.com/rstudio/cheatsheets/raw/master/time-series.pdf
Cite: Goldstein ND. Cheat sheets for the epidemiologist using R. Nov 27, 2019. DOI: 10.17918/goldsteinepi.
