Calculating statistics from stochastic agent-based models
In a classic epidemiology agent-based simulation model, the researcher creates an artificial world and population, sets various states and conditions, and observes hypothetical outcomes over some period of time. To obtain epidemiological measures of morbidity or mortality, such as disease incidence or prevalence, statistics can be calculated from the various parameters used during the modeling. If only a single simulation model is run, then this process is straightforward: simply tally the numbers for the entire population. However, frequently we wish to obtain precision estimates surrounding our point estimates, necessitating many replications of the simulation model, sometimes hundreds, thousands, or even millions. At the conclusion of the simulated runs, the researcher can obtain a median estimate of the desired parameter and quantiles of the parameter estimates (e.g., 95% interval of the distribution of the estimates). Yet there are some interesting subtleties to this calculation that have the potential to result in widely different estimates.
Suppose we run a simulation with five replicates across ten timesteps. "Timestep" is an arbitrary designation, and could be hours, days, years, or so on. For each simulation and for each timestep it is possible to obtain the desired parameter estimate. The following data depict 10 timesteps of data obtained from 5 simulations; each cell represents the statistics of interest (e.g., new cases of disease) for that timestep for a given simulation.
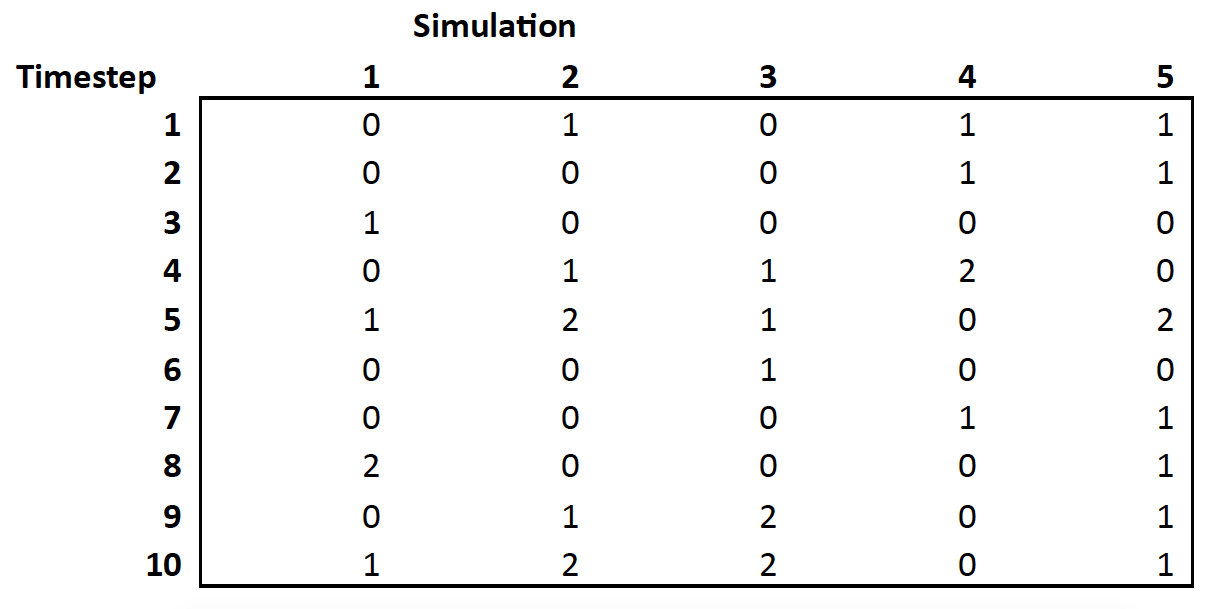
At the conclusion of running all of the individual models, we want to of course calculate some overall statistics in our simulated world. Let's suppose the numbers correspond to the count of new infections. There are a couple of options:
- We can perform a row mean, which gives us the average number of new infections at each timestep, OR,
- We can perform a column mean, which gives us the average number of new infections for each simulation.
Then, to obtain the mean number of new cases for the entire world, we would average either the statistics from #1 or #2. The problem is these calculations can differ, sometimes by meaningful amounts. Which is correct?
This is an interesting question about stochastic modeling in general and there is no single correct answer. The most appropriate choice will depend on the specific research question and framing of the outcome. For time-specific outcomes, where the time-variation is strong, #1 is the best choice. Otherwise, this variation will be averaged out and we would not reveal, say, the epidemic curve in the data. In other words, we would use the first option to reveal the variability in results at specific time steps or finding timing or value of peak incidence. If, on the other hand, there is an equilibrium that has been achieved in the data without significant time-variation, then #2 might be a better choice. Further, #2 is appropriate if the researcher would like to calculate cumulative incidence for the entire simulation and then compare incidence statistics across scenarios to a reference category, such as calculating the number of infections averted from some intervention. In short, the appropriate approach depends on the type of outcome.
Thank you to Samuel Jenness from Emory University for assistance with answering this question.Cite: Goldstein ND. Calculating statistics from stochastic agent-based models. Jan 14, 2020. DOI: 10.17918/goldsteinepi.
